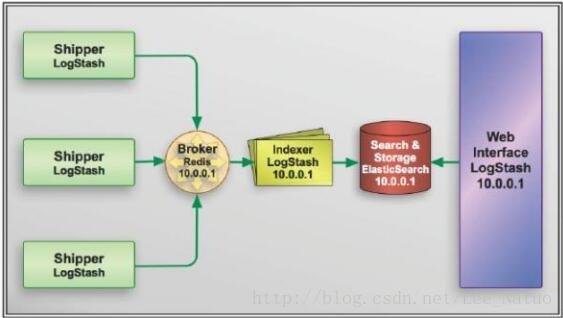
ELK工作流程
-
多个独立的Agent(Shipper)负责收集不同来源的数据,一个中心Agent(Indexer)负责汇总和分析数据,在中心Agent前的Broker(使用Redis实现)作为缓冲区,中心Agent后的ElasticSearch用于存储和搜索数据,前端的Kibana提供丰富的图表展示。
-
Shipper表示日志收集,使用LogStash收集各种来源的日志数据,可以是系统日志、文件、Redis、mq等等;
-
Broker作为远程Agent与中心Agent之间的缓冲区,使用Redis实现,一是可以提高系统的性能,二是可以提高系统的可靠性,当中心Agent提取数据失败时,数据保存在Redis中,而不至于丢失;
-
中心Agent(Indexer)也是LogStash,从Broker中提取数据,可以执行相关的分析和处理(Filter);
-
ElasticSearch用于存储最终的数据,并提供搜索功能;
-
Kibana提供一个简单、丰富的Web界面,数据来自于ElasticSearch,支持各种查询、统计和展示
机器部署
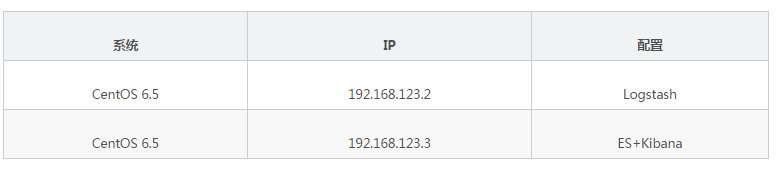
Logstash
(Logstash部署在IP为192.168.123.2的机器上。)
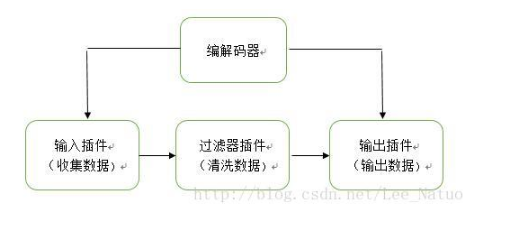
数据流
input|decode|filter|encode|output
安装和配置
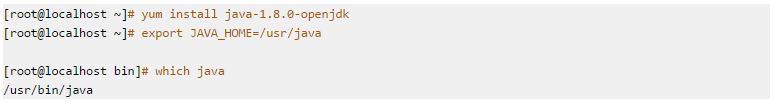
1.安装Java环境
2.下载并安装GPG key
[root@localhost ~]# rpm --import http://packages.elasticsearch.org/GPG-KEY-elasticsearch
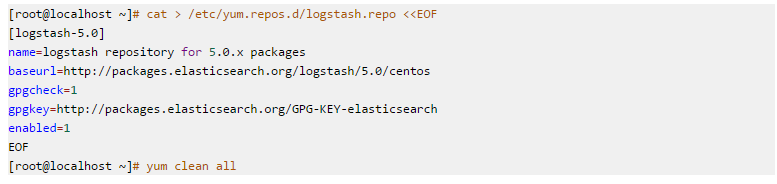
3.yum源配置
3.安装Logstash
[root@localhost ~]# yum install logstash
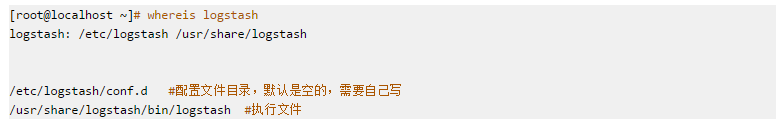
4.安装目录
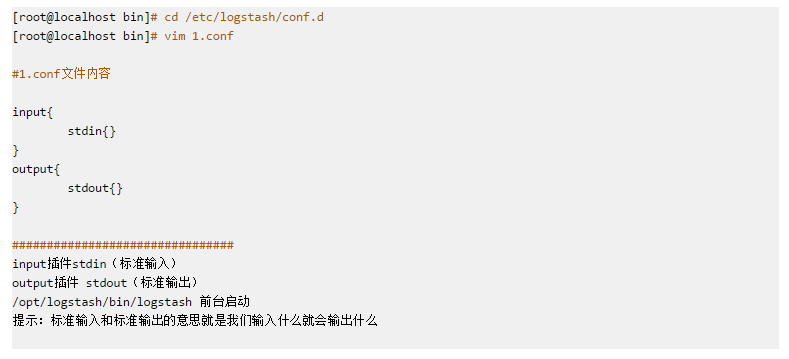
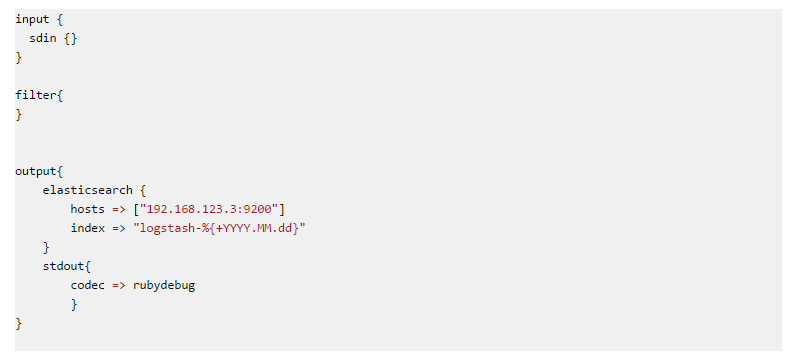
5.编辑一个简单的配置文件
将日志存储到ES中的配置:
6.运行测试
[root@localhost ~]# cd /usr/share/logstash/bin [root@localhost ~]# ./logstash -e 'input{stdin{}}output{stdout{} }' #-e参数表示执行,然后会发现终端在等待你的输入。没问题,敲入 hello,ichunqiu! ,回车,然后看看会返回什么结果。 结果: OpenJDK 64-Bit Server VM warning: If the number of processors is expected to increase from one, then you should configure the number of parallel GC threads appropriately using -XX:ParallelGCThreads=N hello,ichunqiu! --- jar coordinate com.fasterxml.jackson.core:jackson-annotations already loaded with version 2.7.1 - omit version 2.7.0 --- jar coordinate com.fasterxml.jackson.core:jackson-databind already loaded with version 2.7.1 - omit version 2.7.1-1 Sending logstash logs to /var/log/logstash/logstash.log. Pipeline main started 2017-12-16T13:23:56.586Z localhost.localdomain hello,ichunqiu! 2017-12-16T13:23:56.586Z localhost.localdomain hello,ichunqiu! 7.遇到的问题:
[root@localhost bin]# ./logstash -e 'input{stdin{}}output{stdout{codec=>rubydebug} }' OpenJDK 64-Bit Server VM warning: If the number of processors is expected to increase from one, then you should configure the number of parallel GC threads appropriately using -XX:ParallelGCThreads=N --- jar coordinate com.fasterxml.jackson.core:jackson-annotations already loaded with version 2.7.1 - omit version 2.7.0 --- jar coordinate com.fasterxml.jackson.core:jackson-databind already loaded with version 2.7.1 - omit version 2.7.1-1 Logstash has a new settings file which defines start up time settings. This file is typically located in $LS_HOME/config or /etc/logstash. If you installed Logstash through a package and are starting it manually please specify the location to this settings file by passing in "--path.settings=/path/.." in the command line options {:level=>:warn} Failed to load settings file from "path.settings". Aborting... {"path.settings"=>"/usr/share/logstash/config", "exception"=>Errno::ENOENT, "message"=>"No such file or directory - /usr/share/logstash/config/logstash.yml", :level=>:fatal} 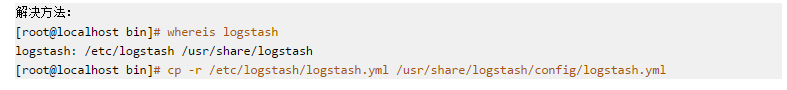
ElasticSearch
数据流

安装和配置
如果是在不同机器上安装,则需要像Logstash的步骤1一样配置好Java环境。
(本文在不同机器上部署,以下配置在IP为192.168.123.3的机器上进行。)
1.下载并安装GPG key
[root@localhost ~]# rpm --import https://packages.elastic.co/GPG-KEY-elasticsearch
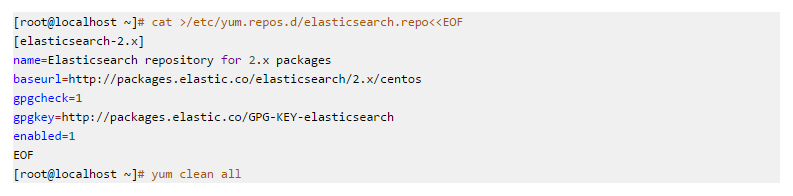
2.yum源配置
3.安装ElasticSearch
[root@localhost ~]# yum install elasticsearch
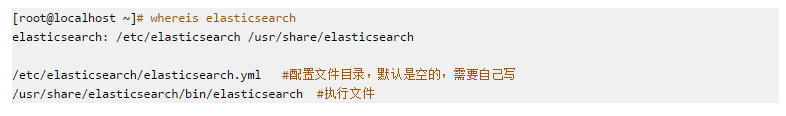
4.安装目录
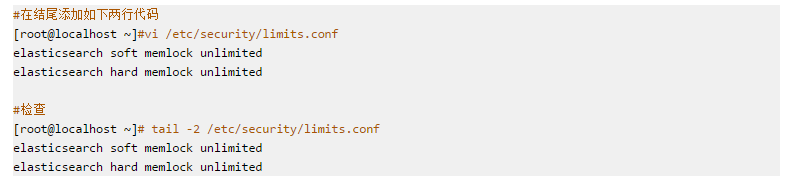
5.修改 limits.conf
6.创建目录并授权
[root@localhost ~]# mkdir -p /data/es-data [root@localhost ~]# chown -R elasticsearch.elasticsearch /data/es-data/
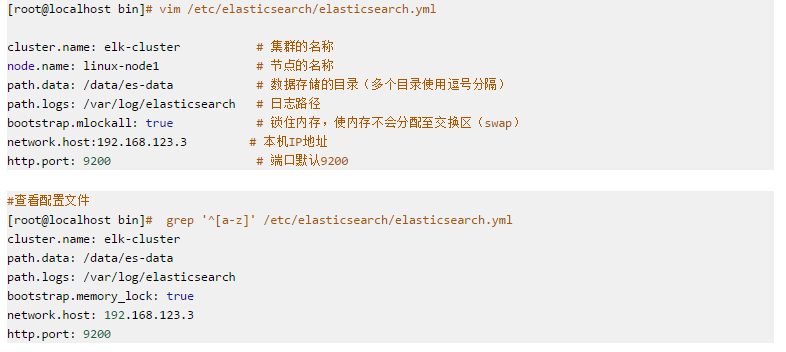
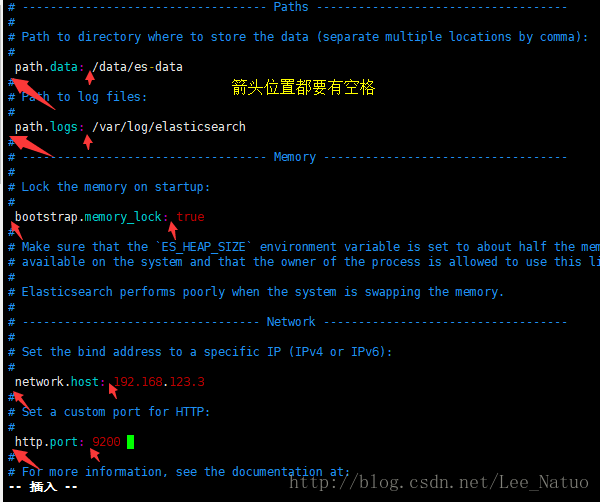
7.配置elasticsearch.yml
8.启动ElasticSearch
[root@localhost elasticsearch]# /etc/init.d/elasticsearch start 正在启动 elasticsearch:OpenJDK 64-Bit Server VM warning: If the number of processors is expected to increase from one, then you should configure the number of parallel GC threads appropriately using -XX:ParallelGCThreads=N [确定]
8.检查启动
[root@localhost init.d]# ps -ef|grep elasticsearch 498 4094 1 42 22:46 ? 00:00:20 /usr/bin/java -Xms256m -Xmx1g -Djava.awt.headless=true -XX:+UseParNewGC -XX:+UseConcMarkSweepGC -XX:CMSInitiatingOccupancyFraction=75 -XX:+UseCMSInitiatingOccupancyOnly -XX:+HeapDumpOnOutOfMemoryError -XX:+DisableExplicitGC -Dfile.encoding=UTF-8 -Djna.nosys=true -Des.path.home=/usr/share/elasticsearch -cp /usr/share/elasticsearch/lib/elasticsearch-2.4.6.jar:/usr/share/elasticsearch/lib/* org.elasticsearch.bootstrap.Elasticsearch start -p /var/run/elasticsearch/elasticsearch.pid -d -Des.default.path.home=/usr/share/elasticsearch -Des.default.path.logs=/var/log/elasticsearch -Des.default.path.data=/var/lib/elasticsearch -Des.default.path.conf=/etc/elasticsearch root 4142 1524 0 22:47 pts/0 00:00:00 grep elasticsearch
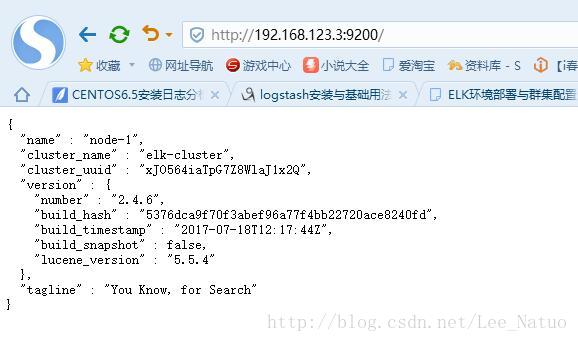
9.访问测试
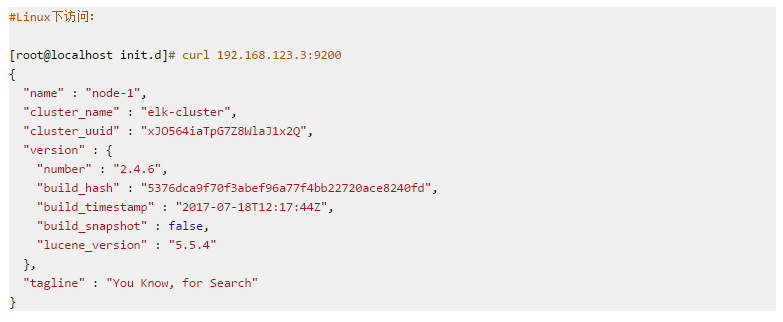
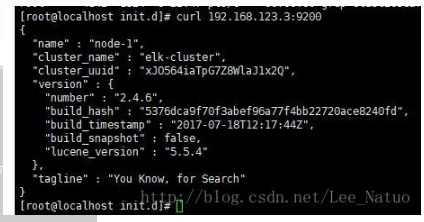
windows下访问:
10.遇到的问题;
[root@localhost elasticsearch]# /etc/init.d/elasticsearch start #运行该命令时失败
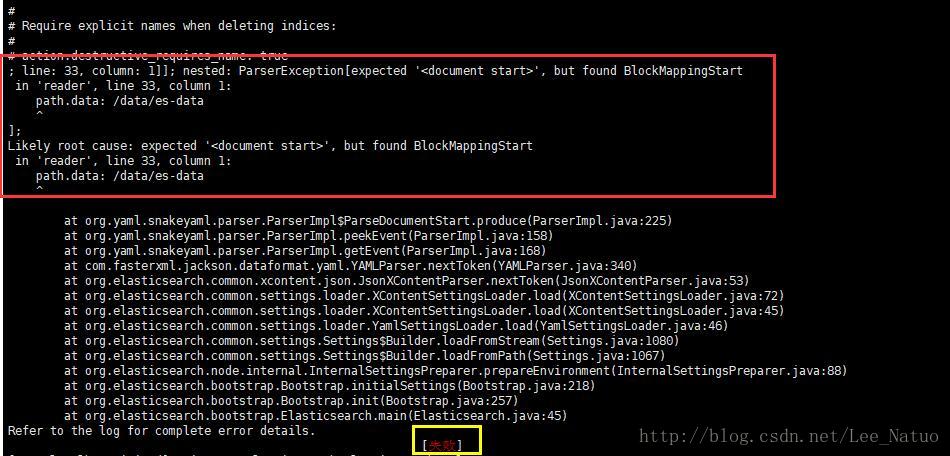
解决方法: 在错误提示的地方加空格。
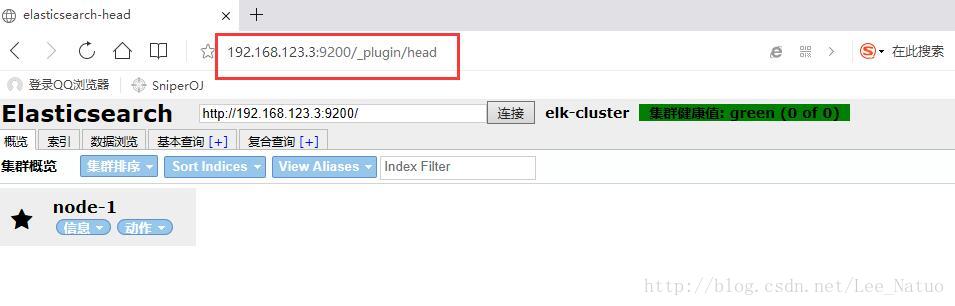
11.安装Elasticsearch插件
[root@localhost init.d]# /usr/share/elasticsearch/bin/plugin install mobz/elasticsearch-head -> Installing mobz/elasticsearch-head... Trying https://github.com/mobz/elasticsearch-head/archive/master.zip ... Downloading ......................................................................................................................................................................................................................................................................................................................................................................................................................................................................................................................................................................................DONE Verifying https://github.com/mobz/elasticsearch-head/archive/master.zip checksums if available ... NOTE: Unable to verify checksum for downloaded plugin (unable to find .sha1 or .md5 file to verify) Installed head into /usr/share/elasticsearch/plugins/head #安装路径 #访问 在浏览器中访问地址:http://ip地址:9200/_plugin/head/
在此我向大家推荐一个架构学习交流群。交流学习群号:575745314 里面会分享一些资深架构师录制的视频录像:有Spring,MyBatis,Netty源码分析,高并发、高性能、分布式、微服务架构的原理,JVM性能优化、分布式架构等这些成为架构师必备的知识体系。还能领取免费的学习资源,目前受益良多

Kibana
安装和配置
1.下载并安装GPG Key:
rpm --import https://packages.elastic.co/GPG-KEY-elasticsearch
2.yum源配置
[root@localhost ~]# vim /etc/yum.repos.d/kibana.repo [kibana-4.5] name=Kibana repository for 4.5.x packages baseurl=http://packages.elastic.co/kibana/4.5/centos gpgcheck=1 gpgkey=http://packages.elastic.co/GPG-KEY-elasticsearch enabled=1 [root@localhost ~]# yum clean all
3.安装Logstash
[root@localhost ~]# yum install kibana
4.安装目录
[root@localhost ~]# whereis kibana kibana: /opt/kibana/bin/kibana /opt/kibana/bin/kibana.bat
5.修改配置文件
[root@localhost ~]# vim /opt/kibana/config/kibana.yml [root@abcdocker ~]# grep "^[a-Z]" /opt/kibana/config/kibana.yml server.port: 5601 #端口,默认5601 server.host: "0.0.0.0" #主机 elasticsearch.url: "http://192.168.123.3:9200" #es地址 kibana.index: ".kibana" #kibana是一个小系统,自己也需要存储数据(将kibana的数据保存到.kibana的索引中,会在ES里面创建一个.kibana) # elasticsearch.username: "user" kibana中的es插件是需要收费的,所以无法使用 # elasticsearch.password: "pass"
6.启动Kibana
[root@abcdocker ~]# /etc/init.d/kibana start #ES也要开启。
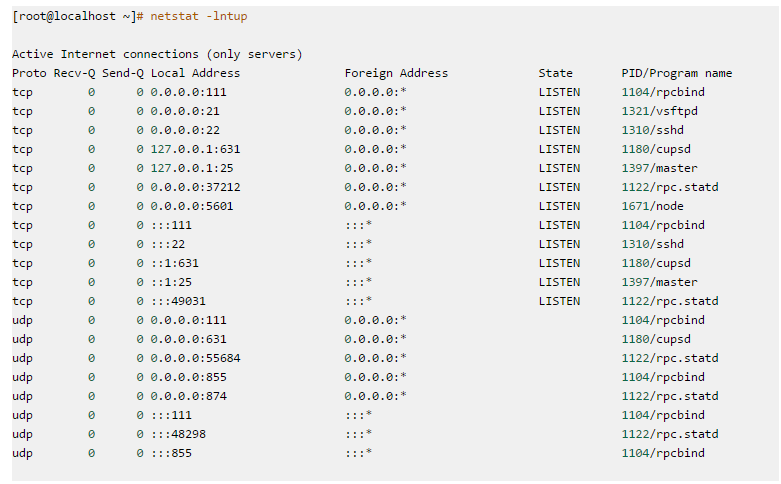
7.检查端口
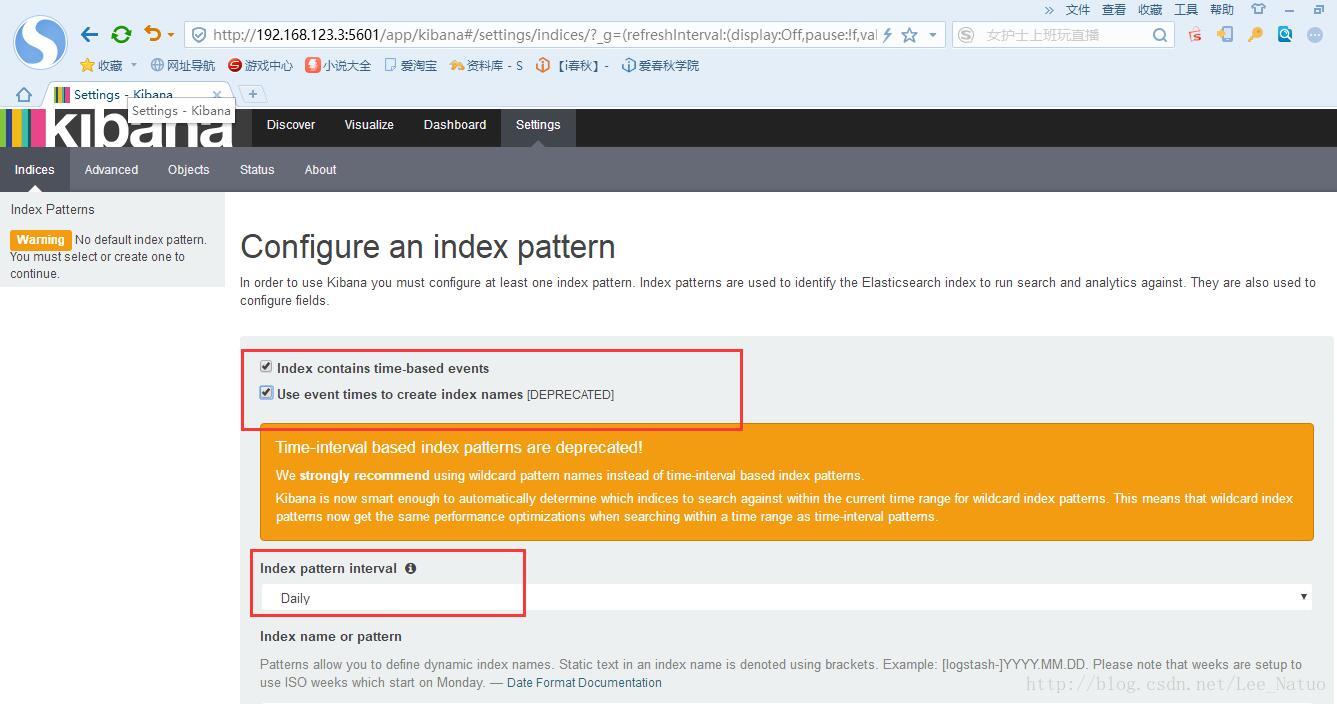
8.访问
访问地址:http://192.168.123.3:5601