前言
Kibana 是一个开源的分析和可视化平台。它提供搜索、查看和与存储在 Elasticsearch 索引中的数据进行交互的功能。可以轻松地执行高级数据分析,并在各种图表、表格和地图中可视化数据。
本篇文章是基于ElasticSearch基础上来写的,为了更好地理解请先移步
-->《ElasticSearch基础入门》(1)安装启动与配置<---
-->《ElasticSearch基础入门》(2)与ES的交互<---
下载与安装
[root@localhost tools]# wget https://artifacts.elastic.co/downloads/kibana/kibana-6.1.3-linux-x86_64.tar.gz [root@localhost tools]# tar -xzvf kibana-6.1.3-linux-x86_64.tar.gz
采坑提醒
kibana和elasticSearch的版本最好要保持一致,不然启动kibana会报错。
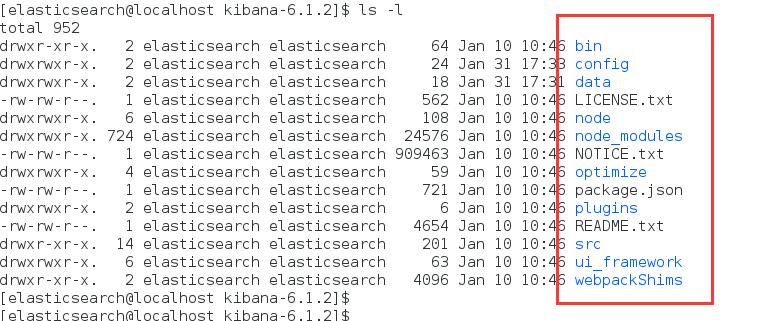
解压后kibana的目录结构是这样的:
配置
我们用vim编辑 config目录下的 kibana.yml , 我们先来看下目前要用到的主要配置
# Kibana is served by a back end server. This setting specifies the port to use. # 自定义端口 server.port: 5601 # Specifies the address to which the Kibana server will bind. IP addresses and host names are both valid values. # The default is 'localhost', which usually means remote machines will not be able to connect. # To allow connections from remote users, set this parameter to a non-loopback address. # 自定义IP server.host: "172.19.26.110" # The URL of the Elasticsearch instance to use for all your queries. # ElasticSearch的IP地址 elasticsearch.url: "http://172.19.26.110:9200"
这里我们只需要配置 server.port 、server.host 、elasticsearch.url 即可,最简单配置其实只配置elasticsearch.url就行了,因为我的Linux环境是搭建在虚拟机里的,所以为了管理方便我需要在宿主机来访问,所以会配置kibana的端口和IP。端口可以改但建议使用kibana默认端口。
启动
打开 kibana安装目录,执行 ./bin/kibana启动服务:
[elasticsearch@localhost kibana-6.1.2]$ ./bin/kibana log [09:34:07.074] [info][status][plugin:kibana@6.1.2] Status changed from uninitialized to green - Ready log [09:34:07.191] [info][status][plugin:elasticsearch@6.1.2] Status changed from uninitialized to yellow - Waiting for Elasticsearch log [09:34:07.278] [info][status][plugin:console@6.1.2] Status changed from uninitialized to green - Ready log [09:34:07.313] [info][status][plugin:metrics@6.1.2] Status changed from uninitialized to green - Ready log [09:34:07.417] [info][status][plugin:elasticsearch@6.1.2] Status changed from yellow to green - Ready log [09:34:07.903] [info][status][plugin:timelion@6.1.2] Status changed from uninitialized to green - Ready log [09:34:07.907] [info][listening] Server running at http://172.19.26.110:5601
然后通过浏览器访问http://172.19.26.110:5601,如下图:
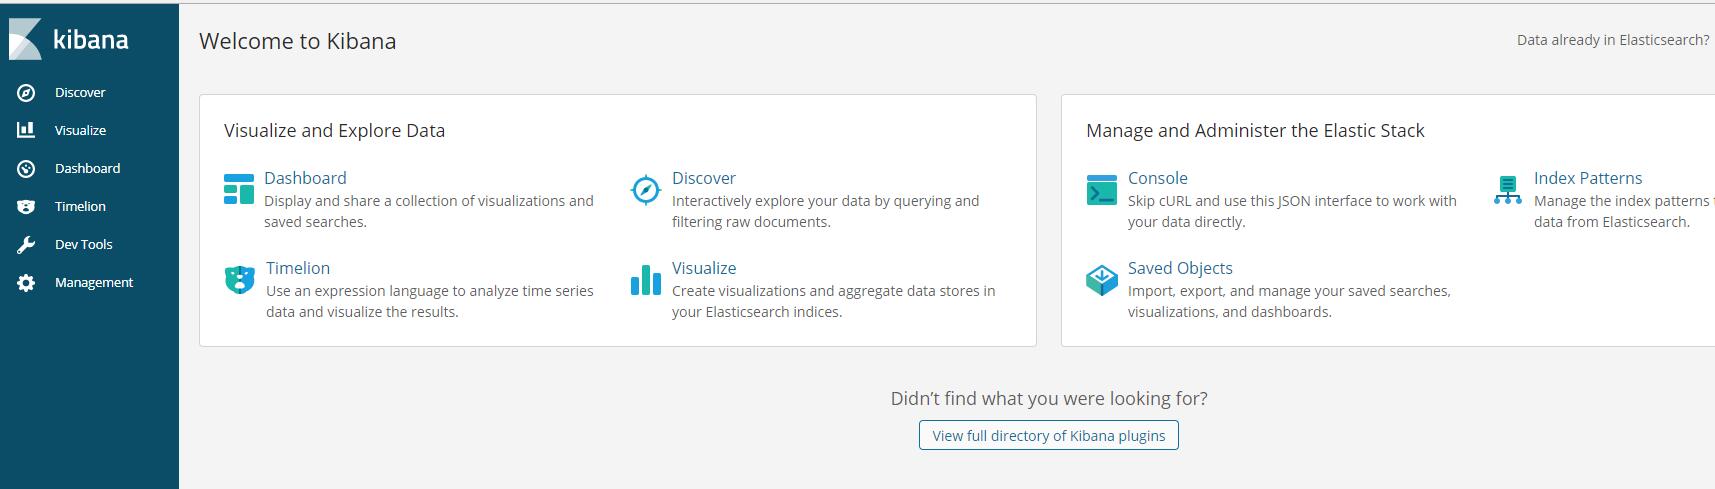
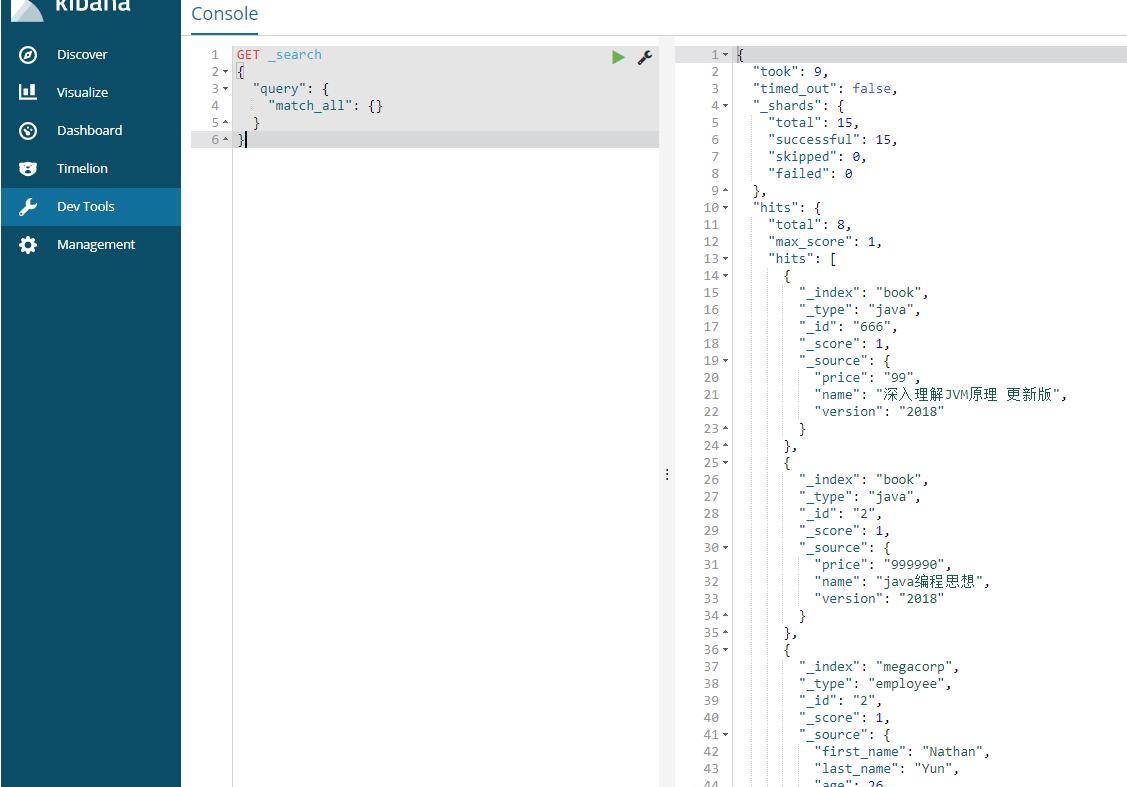
到现在为止,我们的kibana平台就搭建好了,我们可以在左侧菜单栏 Dev Tools 控制台就可以通过表达式来操作elasticSearch服务了,如下: